A scan count tells you someone arrived. It does not tell you whether they booked a table, opened the menu, or left. To track QR code clicks past the scan, you need two layers: scan analytics on the code, and tap analytics on the page it opens. AriaQR gives you both, with no cookies on either.
Why is a scan count not enough?
A scan is the start of a visit, not the result. Two hundred scans on a window poster can mean two hundred bookings or two hundred people who glanced at a slow page and put their phone away. The code cannot see the difference. Only the page can.
So QR code conversion tracking has two halves: who scanned, where, and when, and then what they did once the page loaded. If the destination is a PDF or a third-party profile, you get no second half at all, which is one reason what a QR code should link to matters more than it looks.
What does scan analytics track on every dynamic code?
Every dynamic AriaQR code points at a short link, and the short link is where scans are counted. On every code you get:
- Total scans and unique visitors, counted without cookies.
- Scans per day, and an hour-of-day heatmap in the scanner's local time.
- Device and OS, plus in-app browser detection for scans opened inside Instagram, WhatsApp, and similar apps.
- Country, region, and city when the network allows, plotted on a clustered map.
- Placements, so several codes in one campaign sit side by side.
- CSV export, and alerts for the first scan, a broken destination, or a digest, by email or webhook.
Each number is explained in QR code analytics explained, and the screens are toured in inside the analytics dashboard. This is the arrival layer. It stops at the door.
How do you track QR code clicks after the scan?
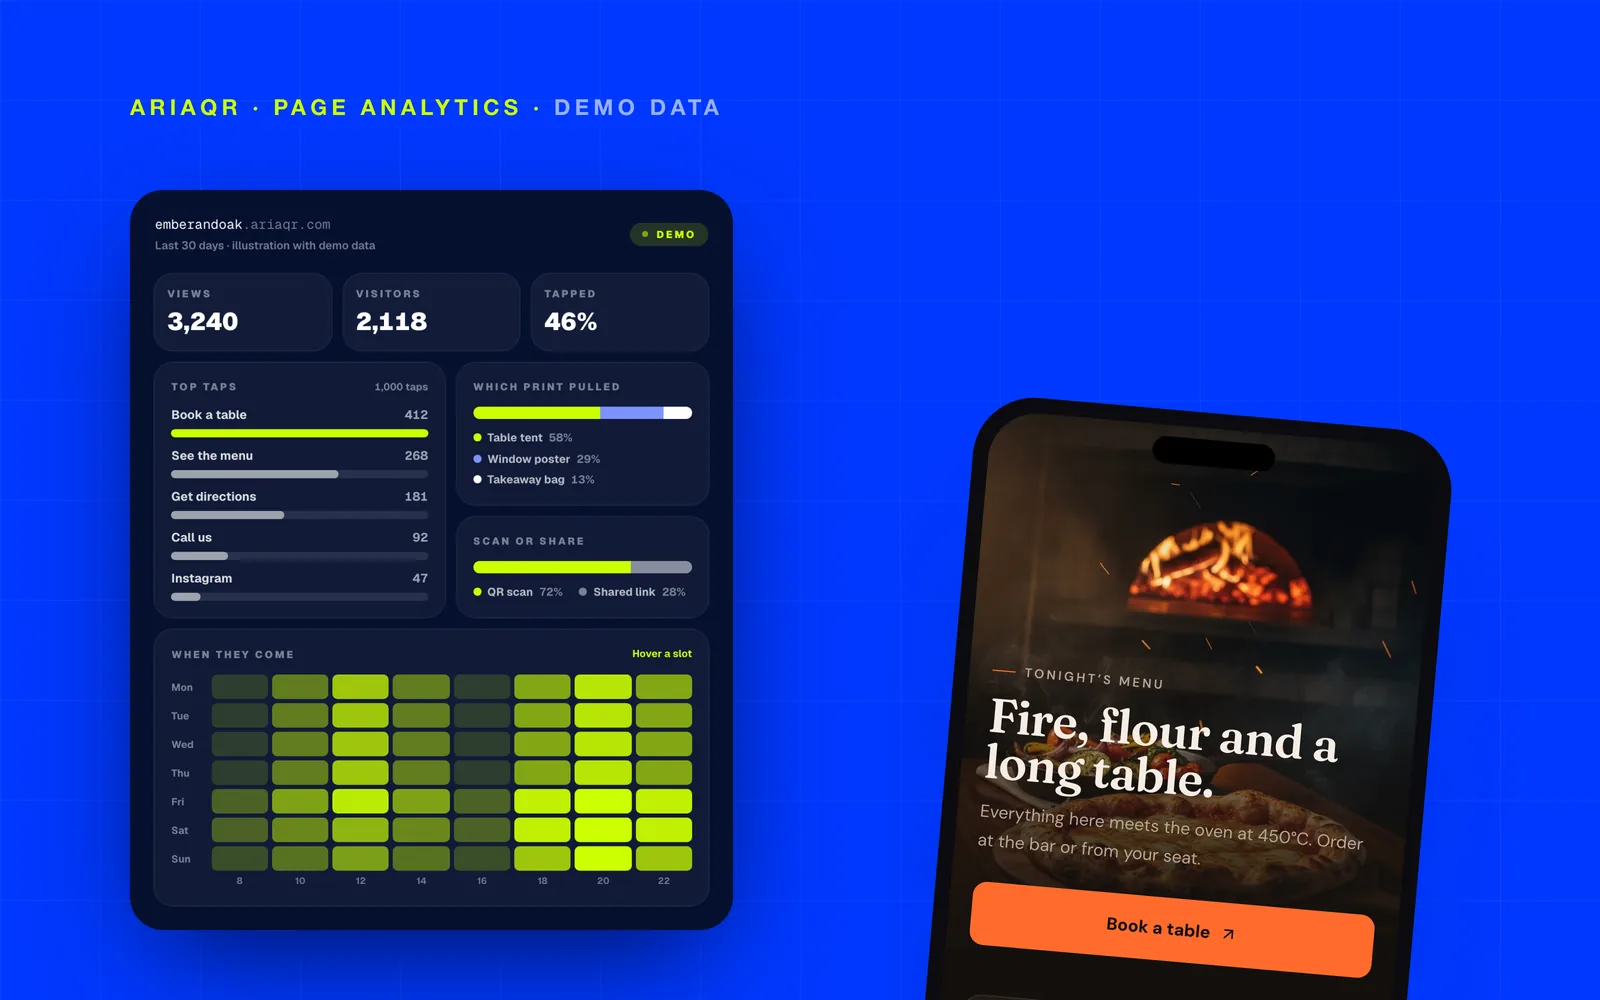
Point the code at an AriaQR landing page. The page analytics picks up where the scan leaves off. For each published page you see:
- Views, and visitors. A visitor is a 24-hour pseudonym, not a cookie, so a repeat visit the same day counts once and nothing follows the person overnight.
- What people tap: every button and link on the page, ranked, with each one's share of taps and its taps as a share of views.
- Tap-through: the share of visitors who tapped something. Next to it, taps per view.
- Views and taps per day, over 7, 30, or 90 days.
- Country and city, and device (mobile, tablet, desktop) and OS.
- When people visit: a weekday-by-hour heatmap in each visitor's local time, with the busiest slot named.
Location comes from the visitor's network, not the phone. You get a city where the network allows it, and a region or country when it does not. Read it as a market, not an address.
Brand pages load no tracking cookies and show no consent banner. There is nothing to switch on.
Which printed code or shared link brought the visit?
The "How people arrive" panel splits every visit into two sources: a QR scan, or the page link opened some other way.
For QR visits, it lists which printed code brought the person, by its short-link code. Put a different code on the table tent, the window poster, and the takeaway bag, all pointing at one page, and you see the views each produced. Name those codes as placements on the scan side and the two views line up. The setup is in which poster actually worked.
For link visits, it buckets where the link was opened from: direct, social, search, or other websites. A page URL pasted into a group chat counts as a link visit, not a scan, and the chat app's link preview is not counted at all.
A worked example: one bistro, three codes, three buttons
Take a fictional bistro in Portland, Maine. The numbers are illustrative, for example only, not real customer data.
The bistro prints three codes, all pointing at one landing page with three buttons: Book a table, See the menu, and Get directions. One code goes on table tents, one on the front window, one on takeaway bags. After 30 days, for example:
- By code: table tents 610 views, the window poster 420, takeaway bags 90.
- What people tap: See the menu first, Book a table second, Get directions last.
- Tap-through: 58 percent.
The table tents lead, and their visitors are already seated, so the menu winning makes sense. But the window poster is the one meant to bring new guests, and bookings are what the owner wants from it. So the owner gives the window code its own page with Book a table at the top. Two weeks later that page's tap list shows whether passersby book, with no guesswork about which crowd tapped what.
Then the heatmap. For example, views peak Friday and Saturday from 6 to 8 p.m., with a smaller band on weekday mornings. The owner adds a server on Friday at 6 and schedules a weekday lunch offer on the page for 11 a.m.
None of this needs a reprint. The printed codes keep their short links, so a new button order or a new page is an edit, not a print run. For layouts that suit this kind of test, see these QR code landing page examples.
Which question goes where?
| Question | Where to look | What to change |
|---|---|---|
| Which printed code pulled the most visits? | Placements, and "By code" on the page | Reprint the winner, move or drop the rest |
| Did people scan, or open a shared link? | "How people arrive" | If links dominate, the page is being shared, so keep it easy to forward |
| Which button won? | "What people tap" | Move the winner to the top, cut or rename the rest |
| Do visitors do anything at all? | Tap-through and taps per view | Shorten the page, sharpen the first button |
| When is the rush? | Weekday-by-hour heatmap | Staff that slot, time the offer just before it |
| Is the page failing on some phones? | Device, OS, in-app browser | Test the page where people actually open it |
Is Google Analytics with UTM tags enough?
Sometimes, yes. If the code points at your own website and GA4 is already installed there, UTM tags on the destination show post-scan behavior in reports you already read, and AriaQR placements can add those tags for you. For a brand with an analytics team and an existing site, that is often the right setup.
What the built-in page analytics adds:
- No setup. No tag to install, no events to configure. Every button and link is counted on publish.
- No cookies and no consent banner, so visitors do not dismiss a pop-up before seeing the page.
- A split by printed code, read from the short link itself, not from tags someone has to remember to add.
Use GA4 where your site already lives. Use a landing page when you want a focused page per campaign and numbers without a setup project.
Where to start
Open AriaQR landing pages. Let the AI design a mobile page from a short brief, or start from one of 66 templates, then edit it in the block editor. Building and previewing are free. Publishing at ariaqr.com/p/your-name or your-name.ariaqr.com, the AI designer, and subdomains are part of the Business plan, so see pricing before you publish. Then make one code per printed placement, point them all at the page, and let the first week of taps tell you which one to print again.